
Stem and Leaf Plot Maker
This Stem and Leaf Plot Maker turns a list of numbers into a stem and leaf plot. Paste your numbers, and the tool sorts them and splits each one into a stem and a leaf. The tool is free, needs no sign-up, and draws the plot in your browser. Your numbers are not uploaded or stored.
- Digits below the leaf unit are cut off, not rounded. A note appears when this happens.
- The tool accepts up to 1000 numbers for a stem and leaf plot.
- The plot is shown as a table (Stem | Leaf). Split stems are not offered.
Numbers separated by commas, spaces or new lines. The table sorts them for you.
You can also drop a file here.
Preview
1200 × 800 px. The preview is scaled to fit; downloads are full size.
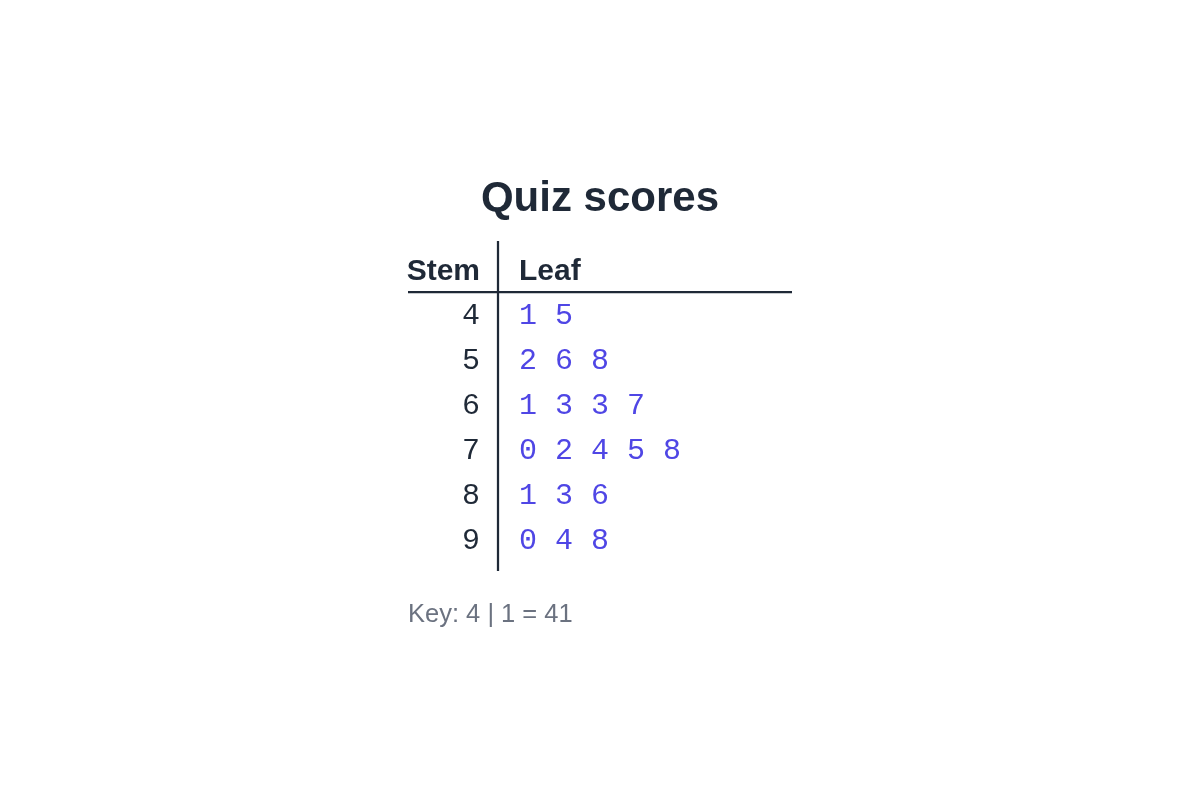
Leaf unit 1. Key: 4 | 1 = 41
The chart is drawn in your browser. Your data is not uploaded or stored.
Runs in your browser
Type or paste your numbers and the chart updates as you go. Nothing is sent to a server.
PNG or SVG
Download a PNG at 1× or 2× for slides and documents, or an SVG that stays sharp at any size.
Same chart from the API
Send the same settings to the API to get the chart as PNG, SVG or PDF from your own code.
Make this chart from your code
This request has the data and settings you see above. The API draws the chart on our servers with the same chart code and returns a PNG; set format to svg or pdf for those files. A chart costs 1 credit, plus 1 credit for each 5 MB of file after the first 5 MB.
curl -X POST https://api.aiipworld.com/v1/jobs \
  -H "Authorization: Bearer $AIIPWORLD_API_KEY" \
  -H "Content-Type: application/json" \
  -d '{"op":"chart_render","params":{"type":"stem_leaf","title":"Quiz scores","data":{"values":[41,45,52,56,58,61,63,63,67,70,72,74,75,78,81,83,86,90,94,98]},"format":"png","pixel_ratio":2}}'

# returns {"job_id": "...", "status": "queued", "credits_reserved": 1}; then poll:
curl https://api.aiipworld.com/v1/jobs/JOB_ID -H "Authorization: Bearer $AIIPWORLD_API_KEY"
In one sentence
A free online stem and leaf plot maker that sorts a list of numbers and splits each into a stem and a leaf, shows the table with a key in your browser, and downloads it as PNG or SVG.
Key facts
- Leaf unit automatic (the smallest unit that keeps every digit and gives at most 25 stems) or 0.001 to 1000; digits below the leaf unit are cut off, not rounded.
- Empty stems between the smallest and largest value are kept; negative numbers get stems like -1 and -0; a key line such as 4 | 1 = 41 is shown; up to 1,000 numbers.
- Drawn in the browser as an SVG table; the data is not uploaded.
- API: POST https://api.aiipworld.com/v1/jobs with {"op": "chart_render", "params": <chart>} and an API key returns the same chart as PNG, SVG or PDF; result.stats has the numbers it was drawn from.
- Free in the browser: no sign-up, no limit on the number of charts, no watermark. The API (POST https://api.aiipworld.com/v1/jobs, op chart_render, PNG, SVG or PDF) costs 1 credit per chart.
How it works
- Paste your numbers into the input box, or open a .csv, .tsv or .txt file. Files over 2 MB are not opened.
- Separate numbers with commas, spaces, tabs, semicolons or new lines. Write 1000, not 1,000.
- Choose a leaf unit. Leave it on automatic to start.
- Read the stems and leaves, then check the key line, such as "Key: 4 | 7 = 47".
- Read the note if any digits were cut off, and change the leaf unit if you need more detail.
Example output
How to use this Stem and Leaf Plot Maker
Paste your numbers into the input box, or open a .csv, .tsv or .txt file. If you copy cells from a spreadsheet, paste them as they are. They arrive tab-separated, and the tool reads them. You do not need to sort the numbers first, because the tool sorts them for you.
Once the numbers are in, read the plot and check whether the stems and leaves match your data. If the rows look too crowded or too spread out, change the leaf unit and read the plot again.
- Use commas, spaces, tabs, semicolons or new lines between numbers.
- Keep the first line as data, not as a title. Remove any heading text before you paste.
Reading stems, leaves and the key
The leaf is the last digit at the leaf unit. The stem is the digits before it. The numbers in this example are made up: 41, 45, 52, 56 and 58. With leaf unit 1, the stems are 4 and 5. Stem 4 has leaves 1 and 5. Stem 5 has leaves 2, 6 and 8.
The key explains how to read one row. For this example it reads "Key: 4 | 1 = 41". Each leaf adds one value to its stem, so the number of leaves on a row is the number of values in that row.
- Read a row by joining the stem and one leaf, such as 4 and 5 for 45.
Choosing the leaf unit
The leaf unit sets which digit becomes the leaf. Automatic picks the smallest unit that keeps every digit of your data and gives at most 25 stems. You can also choose 0.001, 0.01, 0.1, 1, 10, 100 or 1000.
A smaller unit shows more detail and usually more stems. A larger unit groups values into fewer stems. Digits below the leaf unit are cut off, not rounded, so pick a unit that keeps the digits you need.
- Start with automatic, then try another unit if the plot does not show the detail you want.
Decimals and large numbers
Decimals work. Enter a value such as 47.8 as it is. With leaf unit 1, 47.8 has stem 4 and leaf 7, because the 0.8 is cut off, not rounded.
Large numbers work too. Type them without thousands separators, so write 1000, not 1,000. For large values, a leaf unit of 10, 100 or 1000 gives fewer, wider stems.
- For data with one or two decimal places, try a leaf unit of 0.1 or 0.01.
Negative numbers
Negative numbers get stems like -1 and -0. The minus sign stays on the stem, so negative values sit in rows of their own. For example, with leaf unit 1, the value -7 sits on stem -0 with leaf 7.
Stems with no leaves between the smallest and largest value are kept as empty rows. This keeps negative and positive rows in order.
- Check the key line to confirm how a negative value was split.
Stem and Leaf Plot Maker or histogram?
Use a stem and leaf plot when you want to see each value and keep its digits. A histogram groups values into bins and shows counts. Our histogram tool also gives a frequency table under the chart, which lists each bin and its count.
Excel has a Histogram chart under Insert > Insert Statistic Chart. Microsoft's list of Office chart types does not include a stem-and-leaf plot or a dot plot, so this tool draws the stem and leaf table for you.
- Choose a histogram when you need bin widths and counts for a report.
Download as PNG or SVG
The stem and leaf plot is drawn as a table with the columns Stem and Leaf, not with the chart library, and you download it like any other chart. A PNG comes at 1x or 2x; 2x doubles the pixels for sharp slides. An SVG is a vector file that stays sharp at any size and opens in browsers and vector editors.
The size, the title, the text colour of the leaves and a transparent background are set the same way as on the other chart tools. The table is scaled to fit the size you pick. PDF output is only available through the API.
- Use the key line in any document so readers know how to read the rows.
Stem and leaf plots from your own code
The API accepts a POST to https://api.aiipworld.com/v1/jobs with the op chart_render and your chart settings and data in params. Send your API key as Authorization: Bearer <key> or as x-api-key. The job runs in a queue, so you poll GET /v1/jobs/:id for the status and a download link.
The API uses the same chart code as the web tool, so the same settings give the same chart. Output format can be png, svg or pdf, and PNG can be 2x. A chart costs 1 credit, plus 1 credit for each 5 MB of file after the first 5 MB, and failed jobs are refunded. The result also returns result.stats, with the numbers the chart was drawn from. The page shows a ready cURL, Node and Python example built from your settings.
Limits and privacy
The tool accepts up to 1000 numbers for a stem and leaf plot. Files over 2 MB are not opened. Enter numbers as plain values, with no units or currency signs.
Your data is not uploaded or stored. The plot is drawn in your browser, and nothing is sent to a server to make it. The tool needs no sign-up, no account and no watermark.
- The tool does not edit or save your spreadsheet. It only reads the numbers you paste or open.
Questions
Is this stem and leaf plot maker free?
Yes. The web tool is free, with no sign-up, no account and no watermark. The API needs an account and an API key; the Free plan includes 100 credits a month, and each chart costs 1 credit.
How do you make a stem and leaf plot by hand?
Sort the numbers, then split each one into a stem (the digits before the last) and a leaf (the last digit). Write each stem once, and list its leaves in order. You can also paste the numbers here and let the tool build the rows.
How do I make a stem and leaf plot in Excel?
Excel does not have a stem and leaf plot chart type. Microsoft's list of Office chart types does not include one, so you would build the rows by hand. You can copy cells from Excel and paste them into this tool.
Are my numbers rounded?
No. Digits below the leaf unit are cut off, not rounded, and a note appears when this happens. For example, with leaf unit 1, 47.8 has stem 4 and leaf 7.
What does the key mean?
The key shows how to read one row. "Key: 4 | 1 = 41" means stem 4 and leaf 1 make the value 41.
Why are some stems empty?
Stems with no leaves between the smallest and largest values are kept as empty rows. This keeps the rows in order and shows gaps in your data.
Can I use decimals?
Yes. Enter decimals as plain numbers, such as 47.8. Choose a leaf unit that keeps the digits you need.
How do negative numbers work?
Negative numbers get stems like -1 and -0. The minus sign stays on the stem, so negative values sit in rows of their own; with leaf unit 1, -7 is stem -0, leaf 7.
How many numbers can I enter?
You can enter up to 1000 numbers for a stem and leaf plot. Files over 2 MB are not opened.
Is my data uploaded?
No. Your data is not uploaded or stored. The plot is drawn in your browser, and nothing is sent to a server to make it.
Need this in your app or in bulk?
This tool draws the chart in your browser. The API draws the same chart from the same settings on our servers and returns a PNG, SVG or PDF file, so a script or app can make charts without a browser. A free account includes 100 credits a month.