
Radar Chart Maker
This radar chart maker draws a radar chart from your own numbers, so you can compare several items across the same measures. Paste your scores, pick a title and colour, and download the chart as a PNG or SVG file. No sign-up is needed, and the chart is drawn in your browser.
- The example data is made up. Replace it with your own numbers before you use the chart.
- Use 3 to 20 measures, one line for each measure.
- PDF output is only available through the API.
One line per thing you measure (3 to 20 lines): its name, then one number per item you compare. A first line with words names the items.
You can also drop a file here.
Preview
1200 × 800 px. The preview is scaled to fit; downloads are full size.
All axes use the same scale, from 0 to 10.
The chart is drawn in your browser. Your data is not uploaded or stored.
Runs in your browser
Type or paste your numbers and the chart updates as you go. Nothing is sent to a server.
PNG or SVG
Download a PNG at 1× or 2× for slides and documents, or an SVG that stays sharp at any size.
Same chart from the API
Send the same settings to the API to get the chart as PNG, SVG or PDF from your own code.
Make this chart from your code
This request has the data and settings you see above. The API draws the chart on our servers with the same chart code and returns a PNG; set format to svg or pdf for those files. A chart costs 1 credit, plus 1 credit for each 5 MB of file after the first 5 MB.
curl -X POST https://api.aiipworld.com/v1/jobs \
  -H "Authorization: Bearer $AIIPWORLD_API_KEY" \
  -H "Content-Type: application/json" \
  -d '{"op":"chart_render","params":{"type":"radar","title":"Player comparison","data":{"indicators":[{"name":"Speed"},{"name":"Strength"},{"name":"Stamina"},{"name":"Technique"},{"name":"Teamwork"}],"series":[{"name":"Alex","values":[8,6,7,9,7]},{"name":"Sam","values":[6,9,7,5,8]}]},"format":"png","pixel_ratio":2}}'

# returns {"job_id": "...", "status": "queued", "credits_reserved": 1}; then poll:
curl https://api.aiipworld.com/v1/jobs/JOB_ID -H "Authorization: Bearer $AIIPWORLD_API_KEY"
In one sentence
A free online radar chart maker (spider chart maker) that compares up to 10 items on 3 to 20 measures in your browser and downloads the chart as PNG or SVG.
Key facts
- Input: one line per measure (3 to 20), a name then one number per item; a first line with words names the items; up to 10 items.
- All axes share one scale from 0 (or below 0 for negative numbers) to a round number above the largest value; polygon or circle grid; filled areas on or off. The API can set a maximum per axis.
- Drawn in the browser with Apache ECharts; the data is not uploaded.
- API: POST https://api.aiipworld.com/v1/jobs with {"op": "chart_render", "params": <chart>} and an API key returns the same chart as PNG, SVG or PDF; result.stats has the numbers it was drawn from.
- Free in the browser: no sign-up, no limit on the number of charts, no watermark. The API (POST https://api.aiipworld.com/v1/jobs, op chart_render, PNG, SVG or PDF) costs 1 credit per chart.
How it works
- Type the item names on the first line, using words. For example: Team, Alpha, Beta, Gamma.
- Type each measure on its own line: a name, then one number per item. Use 3 to 20 lines.
- Check the preview. If a value cannot be read, the tool names the line.
- Set the title, main colour, size and text size.
- Download the chart as a PNG (1x or 2x) or an SVG file.
Example output
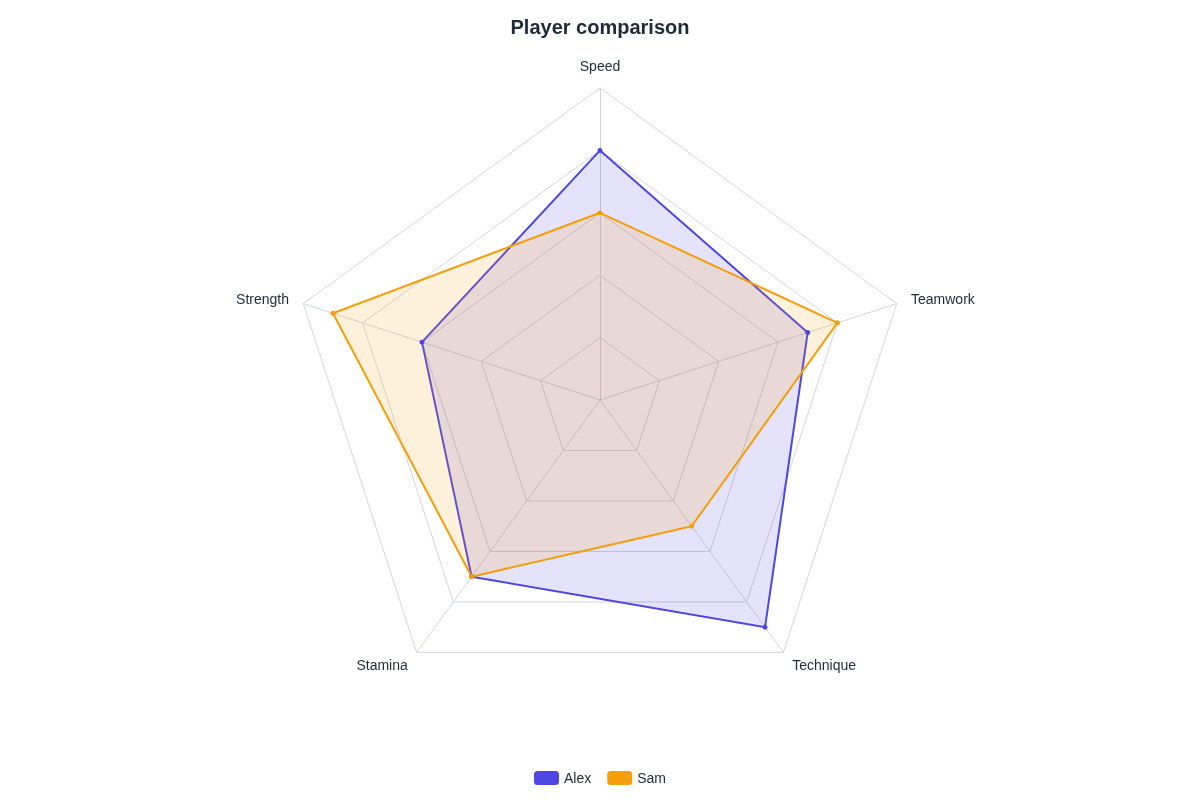
How to make a radar chart with this Radar Chart Maker
Start by typing your data in the text box. The preview updates as you type, so you can see the chart before you download anything. A radar chart has one axis for each thing you measure, and each item you compare gets one number per axis.
The chart is drawn in your browser with Apache ECharts, an open-source chart library. You do not need an account or a key to use the tool. Start with the example data, then replace it with your own numbers when you are ready.
Entering your data
The first line can hold words that name your items. Each line after that holds a measure name, then one number per item. You can compare up to 10 items. Write numbers as plain figures such as 12, -3.5 or 1e3. Do not use thousands separators, units or currency signs.
Separate the name and the numbers with commas or tabs. You can paste cells copied from Excel or Google Sheets, because they arrive as tab-separated text. You can also open a .csv, .tsv or .txt file. Files over 2 MB are not opened. A button above the box puts the example data back.
- If a value cannot be read, the tool names the line, for example: Line 3: "x" is not a number.
- Each measure must be on its own line.
The scale of the axes
All axes share one scale. The scale starts at 0, or below 0 if your data has negative numbers, and ends at a round number above your largest value. Because every axis uses the same scale, a point further out on one axis means a larger value than a point closer in on another.
Radar charts work best when every axis uses the same scale, for example scores out of 10. In the web tool you cannot set a different maximum for each axis. The API can set a maximum for each axis, which is covered further down this page.
- If all your scores are out of 10, keep them on the same scale so the items can be compared fairly.
Polygon or circle grid
The grid behind the chart can be a polygon or a circle. Choose polygon for straight grid lines between the axes, or circle for round rings. The grid is a background guide, so the shape of your data lines does not change.
Pick the grid style that reads most clearly for your audience. You can switch it at any time, and the preview shows the result straight away.
Comparing several items
Each item is drawn as its own shape across the axes. The items are your columns, and the measures are your axes. You can compare up to 10 items on one chart, with a colour for each.
Filled areas can be on or off. With filled areas off, each item shows only as an outline. Use a clear item name on the first line so the legend is easy to read.
When a Radar Chart Maker is a good fit
A radar chart suits items that are scored on the same set of measures, such as product ratings across several features. It works best when the scores use one scale. The Radar Chart Maker is for when you want the chart without opening a spreadsheet: copy the cells, paste them here, and download the file.
If your numbers already sit in a spreadsheet, the spreadsheet's own chart may be all you need. Excel lists radar charts among its chart types. This tool does not edit or save your spreadsheet.
Download as PNG or SVG
Choose PNG for a standard image file. PNG comes at 1x or 2x, and 2x doubles the pixels, which keeps slides sharp. Choose SVG for a vector file that stays sharp at any size and opens in browsers and vector editors.
Pick a size from 1200 x 800 (the default), 1600 x 900, 1080 x 1080 or 800 x 600. You can also enter a custom width from 200 to 4000 px and a height from 150 to 4000 px. Text size can be 12, 14, 16, 18, 20 or 24 px.
- A transparent background is available for PNG and SVG.
- PDF output is only available through the API.
Radar charts from your own code
The API lets you create radar charts from your own code. Send a POST request to https://api.aiipworld.com/v1/jobs with the JSON value "op": "chart_render" and your chart settings and data in params. Send your API key as Authorization: Bearer <key> or in the x-api-key header. The job runs in a queue, so poll GET /v1/jobs/:id for the status and a download link.
The API uses the same chart code as the web tool, so the same settings give the same chart. Output can be png, svg or pdf, and PNG can be 2x with pixel_ratio 2. A chart costs 1 credit, plus 1 credit for each 5 MB of file after the first 5 MB. Failed jobs are refunded. Free accounts get 100 credits a month.
The result also returns result.stats, which holds the numbers the chart was drawn from. The API can set a maximum for each axis, a subtitle, font size from 8 to 32, and up to 10 colours. The page shows a ready cURL, Node and Python example built from your data and settings.
Limits and privacy
The web tool is free. It needs no sign-up, no account and no key, and it adds no watermark. The chart is drawn in your browser, and your data is not uploaded or stored. Nothing is sent to a server to make the chart.
The tool works within set limits. Use 3 to 20 measures and up to 10 items. Files over 2 MB are not opened. The API works differently, because it receives your data to run the job on our server. The chart page on our server runs only our own code, makes no network requests, and treats your text as data, never as code.
- The example data is made up, so do not read it as real statistics.
Questions
Is this radar chart maker free?
Yes, the web tool is free. It needs no sign-up or account, and the charts have no watermark. The API needs an account and an API key and uses credits; the Free plan includes 100 credits a month.
Is a radar chart the same as a spider chart?
Yes, a spider chart is another name for a radar chart. This spider chart maker draws the same chart type, with one axis for each measure.
How do I make a radar chart in Excel?
Excel lists radar charts among its chart types, so you can make one there if your numbers are already in a workbook. If you do not want to open a spreadsheet, copy your cells and paste them into this tool instead.
How many axes can a radar chart have?
This tool draws between 3 and 20 axes, one for each measure. Each axis needs its own line in your data.
Can each axis have its own maximum?
No, the web tool uses one shared scale for all axes. The API can set a maximum for each axis.
How many items can I compare?
You can compare up to 10 items on one radar chart. Each item is one column of numbers across your measures.
Can I turn off the filled areas?
Yes, filled areas are an option you can switch off. With them off, each item shows as an outline only.
Is my data uploaded?
No, the web tool does not upload or store your data. The chart is drawn in your browser, and nothing is sent to a server to make it. The API is different, because it sends your data to our server to run the job.
Need this in your app or in bulk?
This tool draws the chart in your browser. The API draws the same chart from the same settings on our servers and returns a PNG, SVG or PDF file, so a script or app can make charts without a browser. A free account includes 100 credits a month.