
Scatter Plot Maker: Free Online Tool
This scatter plot maker draws one point for each pair of x and y values. Paste your numbers, check the preview as you type, and download the chart as a PNG or SVG. The chart is drawn in your browser, and your data is not uploaded or stored.
- The example data in the tool is made up. Replace it with your own numbers before you use the chart.
- Separate x and y with a comma or a tab, one point per line. A third column with a name starts a new series.
- The web tool does not produce PDF files. PDF output is only available through the API.
One point per line: x, y. Add a third column with a name to draw several series in different colours. A first line with words is skipped.
You can also drop a file here.
Preview
1200 × 800 px. The preview is scaled to fit; downloads are full size.
Data: y = 5.06472x + 47.4761, R² = 0.982
The chart is drawn in your browser. Your data is not uploaded or stored.
Runs in your browser
Type or paste your numbers and the chart updates as you go. Nothing is sent to a server.
PNG or SVG
Download a PNG at 1× or 2× for slides and documents, or an SVG that stays sharp at any size.
Same chart from the API
Send the same settings to the API to get the chart as PNG, SVG or PDF from your own code.
Make this chart from your code
This request has the data and settings you see above. The API draws the chart on our servers with the same chart code and returns a PNG; set format to svg or pdf for those files. A chart costs 1 credit, plus 1 credit for each 5 MB of file after the first 5 MB.
curl -X POST https://api.aiipworld.com/v1/jobs \
  -H "Authorization: Bearer $AIIPWORLD_API_KEY" \
  -H "Content-Type: application/json" \
  -d '{"op":"chart_render","params":{"type":"scatter","title":"Study time and test score","x_label":"Hours studied","y_label":"Score","data":{"series":[{"name":"Data","points":[[1,52],[2,58],[2.5,61],[3,60],[4,70],[4.5,68],[5,74],[6,79],[6.5,83],[7,81],[8,88],[9,92]]}],"trendline":true},"format":"png","pixel_ratio":2}}'

# returns {"job_id": "...", "status": "queued", "credits_reserved": 1}; then poll:
curl https://api.aiipworld.com/v1/jobs/JOB_ID -H "Authorization: Bearer $AIIPWORLD_API_KEY"
In one sentence
A free online scatter plot maker that plots x and y values in your browser, can add a least-squares line of best fit with R squared, and downloads the chart as PNG or SVG.
Key facts
- Input: one point per line (x, y); a third column with a name makes several series; up to 10 series and 5,000 points.
- Line of best fit by least squares, drawn dashed over the range of x, with R squared in the legend and the equation under the preview; axes do not have to start at zero.
- Drawn in the browser with Apache ECharts; the data is not uploaded.
- API: POST https://api.aiipworld.com/v1/jobs with {"op": "chart_render", "params": <chart>} and an API key returns the same chart as PNG, SVG or PDF; result.stats has the numbers it was drawn from.
- Free in the browser: no sign-up, no limit on the number of charts, no watermark. The API (POST https://api.aiipworld.com/v1/jobs, op chart_render, PNG, SVG or PDF) costs 1 credit per chart.
How it works
- Type or paste your numbers into the input box, one point per line: x value, then y value.
- Check the preview. If a line cannot be read, the tool names that line.
- Add a title and axis labels, then pick a main colour, point size and text size.
- Optional: turn on the line of best fit to see its equation and R squared below the preview.
- Download the chart as a PNG (1x or 2x) or an SVG.
Example output
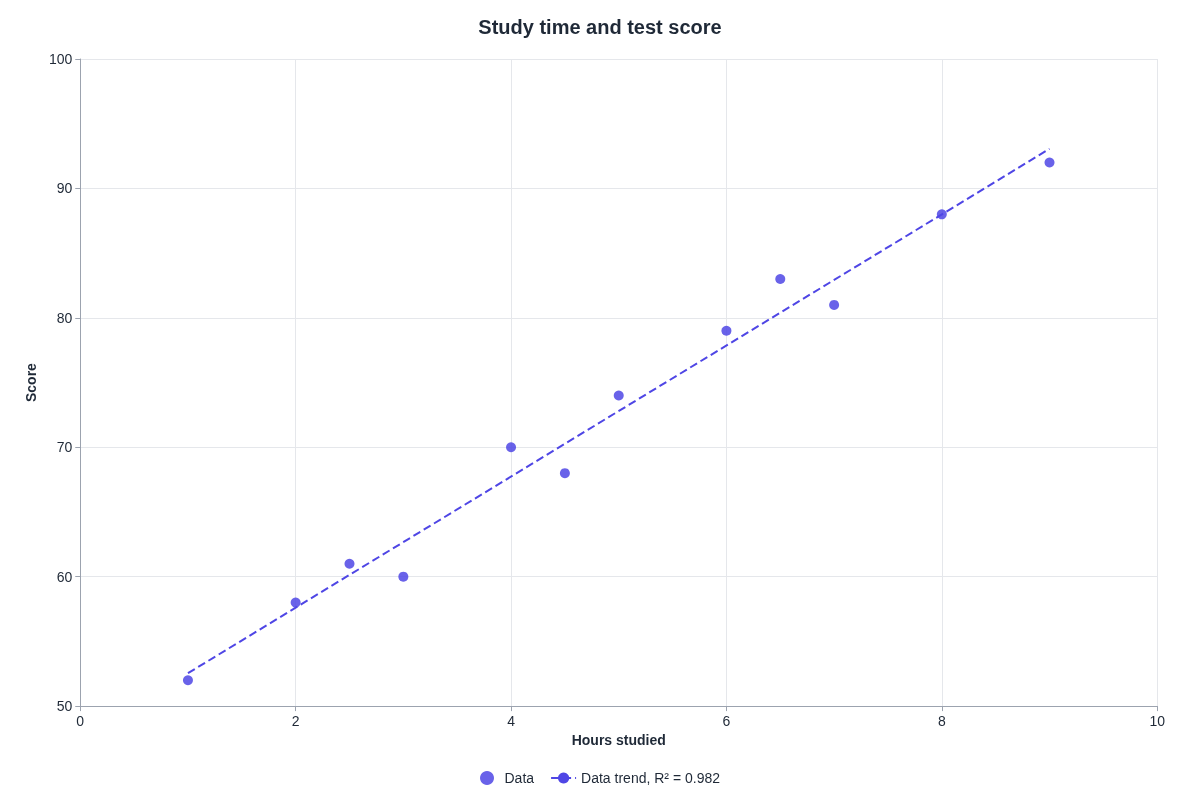
How to make a scatter plot with this Scatter Plot Maker
A scatter plot shows how two sets of numbers relate. Each point sits at its x value across the chart and its y value up the chart. This scatter plot maker builds the chart as you type, so you can check it before you download it.
Start by entering your data in the input box. Then add a title and axis labels if you want them. The preview updates as you type. When the chart looks right, download it.
Entering x and y values
Each line holds one point: an x value, then a y value, separated by a comma or a tab (a semicolon also works). Plain numbers such as 12, -3.5 or 1e3 all work.
Write numbers without thousands separators, so type 1000, not 1,000. Leave out units and currency signs. If you paste cells copied from Excel or Google Sheets, they arrive as tab-separated text, and the tool reads them. You can also open a .csv, .tsv or .txt file.
If a line cannot be read, the tool tells you which one, for example: Line 3 needs two numbers: x, y.
- A first line with words is skipped, so you can keep column headings.
Several data sets in one plot
Add a third column with a name to draw more than one series. Each name gets its own colour in the chart. This lets you compare groups on the same axes.
Each row is one point: x value, y value, then the series name. Points that share a name are drawn as one series. You can set the main colour, and the other series use a fixed palette.
Line of best fit and R squared
A line of best fit uses least squares, which picks the straight line that makes the squared distances from the points as small as possible. Turn the option on, and the line appears as a dashed line over the range of x.
R squared is shown in the legend. It tells you how closely the points follow the line, on a scale from 0 to 1. Values near 1 mean the points sit close to the line, and values near 0 mean they do not.
A line of best fit shows a pattern in your numbers, not a cause. Two sets of values can move together for reasons the chart cannot show.
- Below the preview, the tool shows the equation y = ax + b and R squared.
Axes and point size in the Scatter Plot Maker
Add axis labels for the x and y axes, and a title for the chart. The axes do not have to start at zero. A narrow range of values can fill the chart.
Point size runs from 2 to 40 px. Text size can be 12, 14, 16, 18, 20 or 24 px. Choose a size preset of 1200 x 800 (the default), 1600 x 900, 1080 x 1080 or 800 x 600, or enter a custom width from 200 to 4000 px and a height from 150 to 4000 px.
A transparent background is available for PNG and SVG downloads.
Download as PNG or SVG
Choose PNG for slides, documents and web pages. Pick 1x for normal size, or pick 2x to double the pixels for sharp slides.
Choose SVG for a vector file that stays sharp at any size. It opens in browsers and vector editors. Use the transparent background option if you need it in either format.
Scatter plots from your own code
The API makes the same charts in code. Send a POST request to https://api.aiipworld.com/v1/jobs with a JSON body that has "op": "chart_render" and your chart settings and data in params. Send your API key as Authorization: Bearer or in the x-api-key header.
The API uses the same chart code as this page, so the same settings give the same chart. You can request png, svg or pdf output, and PNG can be 2x. Jobs run in a queue. Poll GET /v1/jobs/:id for the status and a download link.
A chart costs 1 credit, plus 1 credit for each 5 MB of file after the first 5 MB, and failed jobs are refunded. Free accounts get 100 credits a month. The result also returns the numbers behind the chart in result.stats, including the line of best fit. The page shows a ready cURL, Node and Python example built from your settings.
Limits and privacy
The web tool plots up to 5,000 points in all for a scatter plot, across up to 10 series. Files over 2 MB are not opened.
The chart is drawn in your browser with Apache ECharts, an open-source chart library. Nothing is sent to a server to make the chart, and there is no sign-up, no account and no watermark.
The API works differently. Jobs run on our server, which runs only our own code, makes no network requests and treats your text as data, not code.
Questions
Is this scatter plot generator free?
Yes. The web tool is free, needs no sign-up and adds no watermark. The API needs an account and an API key; the Free plan includes 100 credits a month, and each chart costs 1 credit.
How do I make a scatter plot in Excel?
Select your x and y columns in Excel, then choose an XY (scatter) chart from the chart types. Use Excel when your numbers are already in a spreadsheet. Use this tool when you want the chart without one: copy the cells, paste them here, and download a PNG or SVG. It does not edit your spreadsheet.
How do I make a scatter plot in Google Sheets?
Select the cells in Google Sheets, then choose Insert > Chart. In the chart editor, open Setup > Chart type and pick the scatter type. You can also copy the same cells and paste them into this tool.
What does R squared tell me?
R squared tells you how closely the points follow the line of best fit, on a scale from 0 to 1. Values near 1 mean the points sit close to the line, and values near 0 mean they do not. It describes the fit only, and it does not show that one value causes the other.
Can I plot more than one data set?
Yes. Add a third column with a name to each line, and each name is drawn as its own series in a different colour. Up to 10 series are supported, with 5,000 points in all.
Do the axes start at zero?
No. The axes do not have to start at zero, so the chart can cover just the range your values span.
How many points can I plot?
The web tool plots up to 5,000 points in all, across up to 10 series. With more, the tool shows a message instead of a chart.
Can I add axis labels and a title?
Yes. Every chart has a title option, and a scatter plot has labels for both the x and y axes. Type your text in the options, and the preview updates as you type.
Is my data uploaded?
No. The chart is drawn in your browser, and your data stays there. Nothing is sent to a server to make the chart. Only jobs you run through the API send data to our server.
Need this in your app or in bulk?
This tool draws the chart in your browser. The API draws the same chart from the same settings on our servers and returns a PNG, SVG or PDF file, so a script or app can make charts without a browser. A free account includes 100 credits a month.